
A mathematical function is a complete recipe for its graph. The function defines how to find the set of ordered (x, y) pairs of every point on the graph. Just input any x and get the corresponding y.
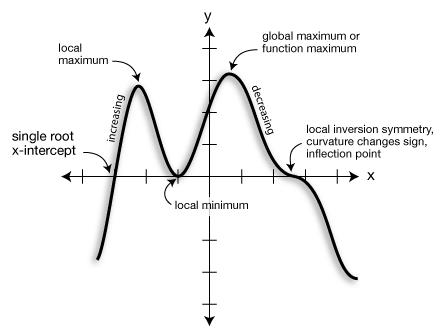
Study the generic function on the right to learn some of the terminology we use to describe the features of a graph.
Maxima and minima-The graph of any function may (or may not) have one or more maxima or minima.
Global maximum - the largest value the function takes on across its whole domain.
Global minimum - the smallest value of the function across its whole domain.
Local maximum - a high point or upward peak in the graph, but not the highest one.
Local minimum - a low point or downward peak in the graph, but not the lowest one.
Increasing function - y-values increase moving left to right.
Decreasing function - y-values decrease moving left to right.
Inflection point - A point of local inversion symmetry; a point at which the curvature changes from concave upward to downward, or from downward to upward.
Reflection symmetry - Mirror-like symmetry across some specified axis. For example, the function f(x) = x2 has mirror symmetry across the y-axis.
Inversion symmetry - Symmetry in which, if each point of a graph is reflected through a single point (the inversion center), the graph will be unchanged. For example, The function f(x) = x3 has a center of inversion symmetry at (0, 0). That point is also an inflection point.
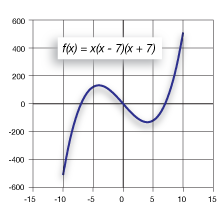
The function at left is cubic. The point (0, 0) is an inversion center and an inflection point. Notice that the curvature of the graph changes from concave downward to concave upward at the inflection point. The graph has a local maximum at about x = -4 and a local minimum at about x = 4. This function has no global maximum or minimum. Instead, we say that it "decreases without bound on the left", and "increases without bound on the right."
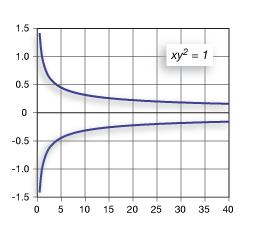
If we solve for y in the equation at right, we get y = ± the square root of x. Because of the ±, we get the two curves shown. (We also see, of course, that this isn't a function because it doesn't pass the vertical line test.) The two curves have reflection symmetry with respect to the x-axis.
Recognizing symmetry like this can be a big help when it comes to solving complicated problems. For example, we might only need to solve for the top half of the graph. The lower values are easily obtained from those by recognizing that they're just the negative of the former.
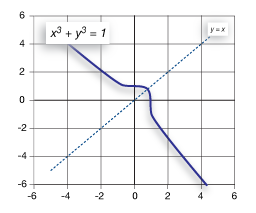
This function has symmetry across the line y=x. Later, we'll learn that means that this function is its own inverse.
Discontinuities
Some functions contain other features called discontinuities, points where the smooth curve is broken. These can take several forms. Here's a figure describing the types of discontinuities you are likely to encounter.
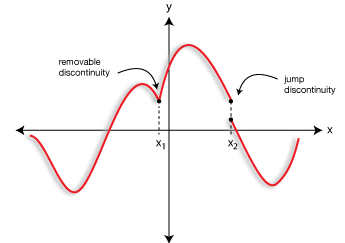 Removable discontinuities are single points where a graph does not vary smoothly. X1 in the figure at left is such a point. Such points are sometimes called "cusps".
Jump discontinuities are actual gaps in the graph.
![]()