Parent functions
The most useful way to think about - and remember - functions is by learning the basic parent functions. In each case below, these are the very simplest functions of their type. Any other function in each class can be formed by applying a set of transformations to the parent function. Look at and learn the parent functions first, then we'll learn about transformations.
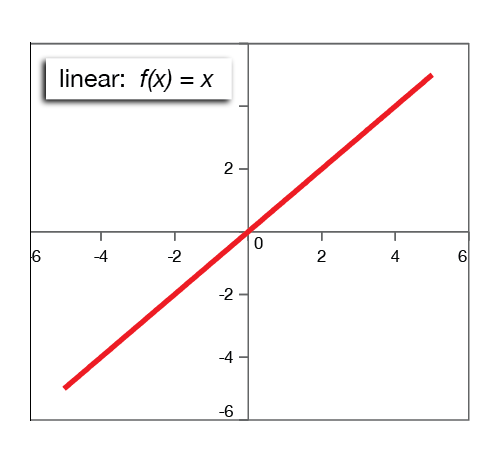
Linear functions
Parent function: f(x) = x.
Notice that the slope of the line is 1. Any other straight line in the Cartesian plane can be formed from this parent function. For example, if we multiply the x-term by 2 to get g(x) = 2x, the graph is a line passing through (0, 0) with a slope of 2. If we add a number to the term containing x, we move the line around on the Cartesian plane. For example, the graph of g(x) = 5x + 3 is a line with a slope of 5 that crosses the y-axis at (0, 3).
One way to recognize a linear function is that (1) the independent variable (x) is raised to the power of 1 (we assume all numbers and variables are raised to the power of 1 unless another power is shown), and (2) x is not in the denominator.
Quadratic Functions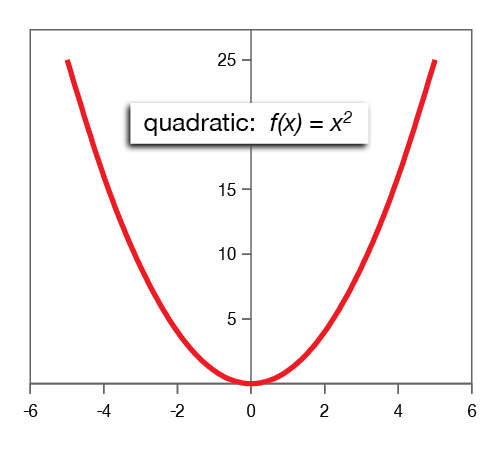
Parent function: f(x) = x2
General form: f(x) = Ax2 + Bx + C.
Quadratic functions are power functions with 2 as the highest power of x.
The graph of a quadratic equation is a parabola. The vertex of the parent parabola lies at (0, 0). This parabola can be transformed into any other parabola by moving the vertex, reflecting the graph across the x-axis and/or changing the steepness of rise of the ends.
For the parent function, A = 1, and B = C = 0. Transformations of the parent function are performed by changing the values of the coefficients A, B and C.
Cubic Functions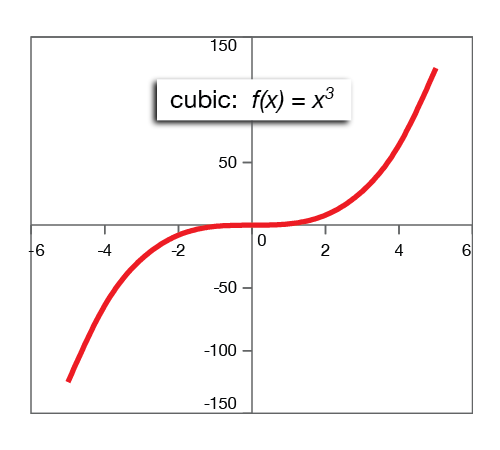
Parent function: f(x) = x3
General form: f(x) = Ax3 + Bx2 + Cx + D
Cubic functions are recognized by the highest power of x being 3. The graph of a cubic function is a sigmoid shape - a sideways S-shape. The point (0, 0) of this graph is called an inflection point - a point where the slope of the curve changes sign.
Rational Functions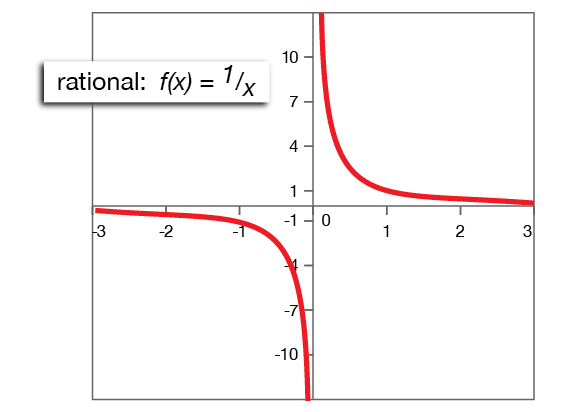
Parent function: f(x) = 1/x
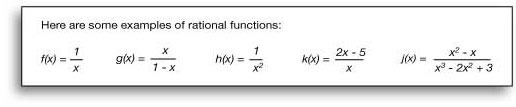
Rational functions are ratios of polynomials. In any rational function, there will be a variable in the denominator. The presence of a variable causes some unusual behavior. Look at the graph at right. As x gets closer and closer to zero from either the left (negative numbers) or right (positive numbers), the value of f(x) gets very large. In fact, it's infinite when x=0. This causes the asymptotic behavior of the graph at x=0.
Absolute-value functions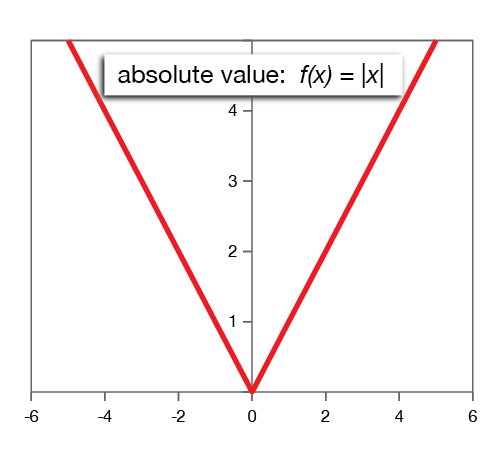
Parent function: f(x) = |x|
General form: f(x) = A|Bx + C| + D
The graph of f(x) = |x| is the same as the graph of the linear function g(x) = x, except that for values of x less than zero, the function cannot take on negative values. This results in the V-shaped appearance of the graph. Just like a parabola, the absolute-value parent function can be transformed at will.
For example, g(x) = |2x - 1| + 2 has a V-shaped graph with sides of slope ±2 and vertex (1, 2).
Exponential Functions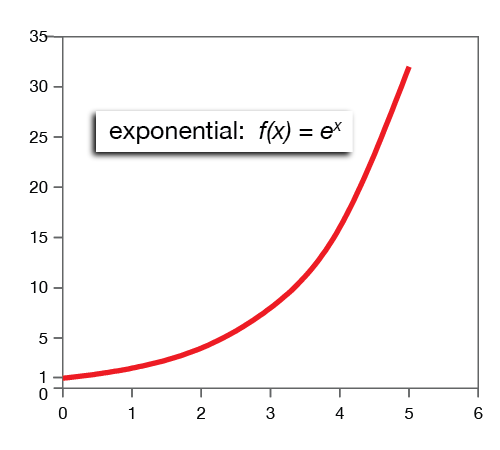
Parent function: f(x) = Ax
General form: f(x) = BAx+C + D
In the formulas above, the number A is called the base. Notice that the independent variable, x, is in the exponent.
This class of functions is very important in modeling growth phenomena like populations, radioactive decay or compound interest.
The hallmark of exponential functions is a period of slow growth, e.g. between x=0 and x=2 in the graph, followed by much more rapid growth.
Logarithmic Functions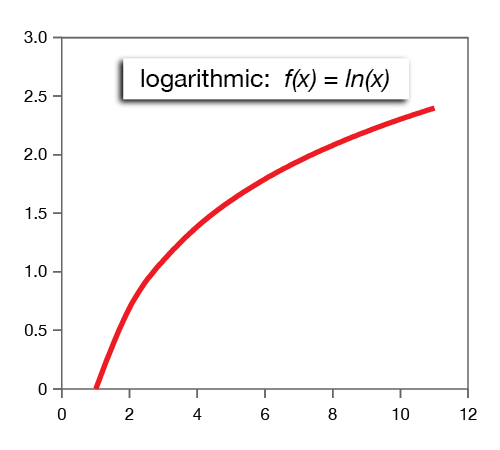
Parent function: f(x) = logb(x)
Logarithmic functions are the inverses of the exponential functions. Log functions are very useful for solving a wide variety of problems in science, economics, finance, statistics and other fields. The b in the definition of f(x) is the base of the logarithm. Another way to read y = logb(x) is "b raised to the y power yields x."
The graphs of log functions show asymptotic behavior at the y-axis and growth that decreases as the independent variable grows.
Root functions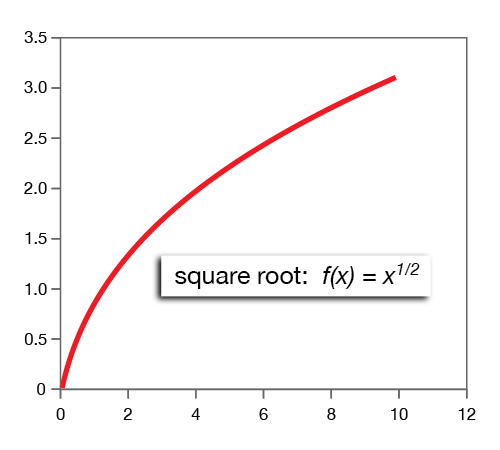
Parent function: f(x) = x1/n , n = 2, 3, 4, ...
You may not be familiar with that notation. Rational (fractional) powers are used to represent roots. For example, x1/2 means the square root of x, x1/3 means the cube root of x, and so on.
The graphs of root functions are different from those of log functions in that (1) they pass through (0, 0) [note that log(0) = 1], and (2) they increase slightly more as x increases.
Also notice that root functions with n even are not defined for x < 0. No real number raised to an even power will yield a negative number.*
*If we allow complex x-values, then this restriction is lifted.
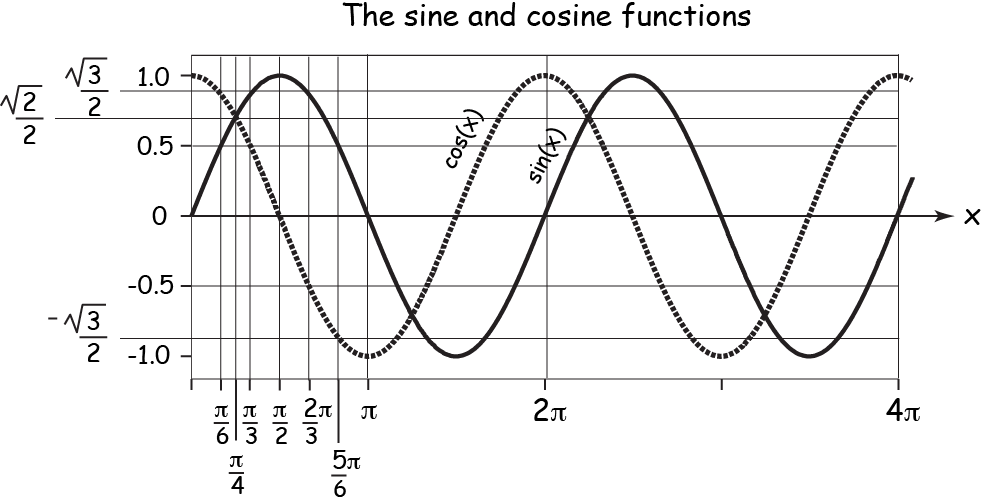
Periodic functions
Our final class of functions is the periodic functions. There are a wide variety of periodic functions that can all, through various tricks, be constructed from the sine function: f(x) = sin(x). Here is a graph of a cycle of the sine and cosine functions. We'll learn much more about these functions later.